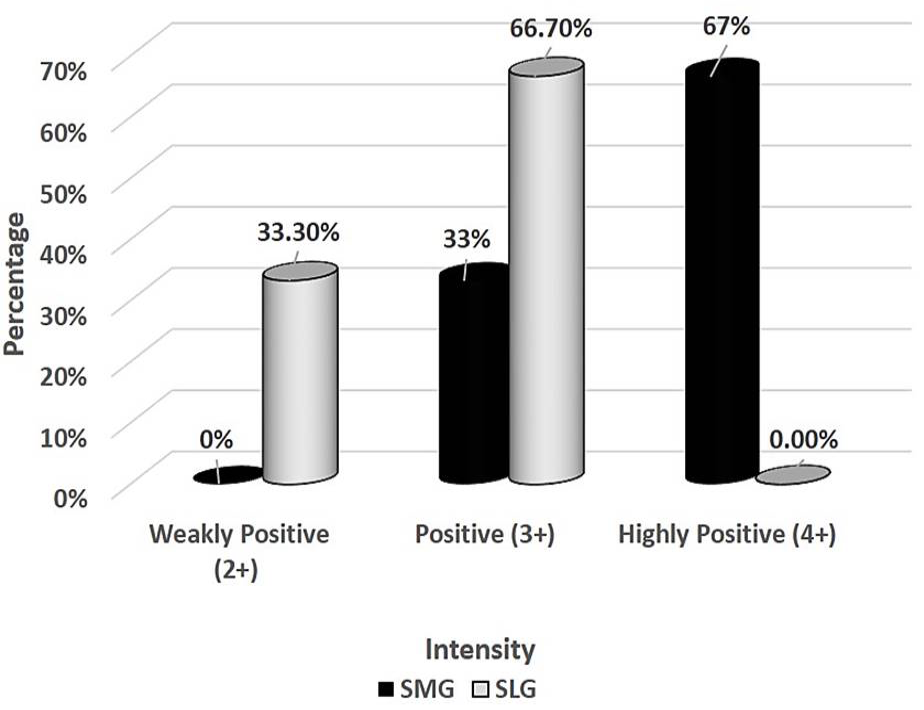
Fig. 2.
Comparison between SMG and SLG of group A1 (week 5): 67% (n=4/6) of SMGs showed intensity score of 4+ (highly positive) and 33% (n=2/6) showed 3+ (positive). While 67% (n=4/6) SLGs showed a score of 3+ (positive) and 33% (n=2/6) showed 2+ (weakly positive) showing that TGF-α expression in ductal epithelial cells of SMG is almost similar to that of SLG. Fisher’s exact test showed that p-value was found to be 0.06.